scenarios
How To Navigate The Cliff Edge In Markets
Research Team
22 October 2019

At a time in which bonds are no longer bonds but rather tax bills, and equities are as expensive as washing machines going on auction at 50 thousand dollars, what role is left to play for us rationale investors?
At a time when machines dominate 90% of daily trading flows, are pitted against other machines to extrapolate a non-existent alpha, and a passive or quasi-passive true nature infected most brands of investing (ETF, risk parity, risk premia, low vol vehicles, quant funds, CTA, all), what role is left to play for us humans?
Lunatic Markets: What Are We To Do?
At a time in which bonds are no longer bonds but rather tax bills, and equities are as expensive as washing machines going on auction at 50 thousand dollars, what role is left to play for us rationale investors?
At a time when machines dominate 90% of daily trading flows, are pitted against other machines to extrapolate a non-existent alpha, and a passive or quasi-passive true nature infected most brands of investing (ETF, risk parity, risk premia, low vol vehicles, quant funds, CTA, all), what role is left to play for us humans?
In fanciful, broken markets where deeply negative interest rates are the norm, and do not prevent policymakers from guidance into further rate cuts yet or endless QE/MMT, what are we to do?
In the past couple of years, we analysed extensively how global markets got close to the cliff edge; and are now stationing there in wait for a market natural disaster to strike. We put forward the ‘Critical Transition Hypothesis’, posing that markets are indeed already well-inside that which in complexity science is called ‘phase transition zone’, the ‘edge of chaos’: this is a far-from-equilibrium state of the system where the dynamics of criticality take charge, and the system fragility is exposed in transition to a whole new regime. We also called this a generational opportunity hidden in plain sight, an historical investment jackpot, for those who have eyes to see it.
Opening one’s eyes may take a lifetime. Seeing is done in a flash. [Anthony de Mello]
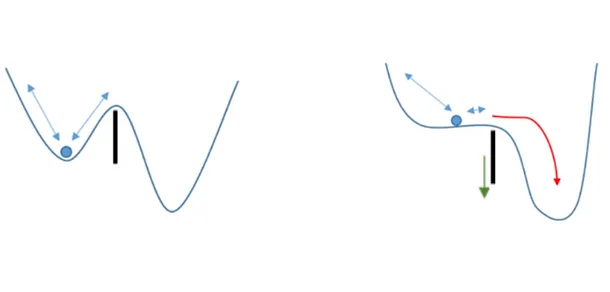
One opportunity which is hard to catch. It involves enduring long periods of pain and duress, as there is no free lunch and no way to go about it except to be found ready and pre-positioned when the time comes. You either in or out.
Wait, for come it will, without fail. [Isaiah 42:4]
If you are going well in the current market conditions, chances are that you are complicit in the long carry, long Beta, long leverage, short vol, short correlation, short Tail Risk game - irrespective of the various marketing labels for the specific strategy. Thus, submissively ready to give it all up when the biblical market adjustment comes through. If you are a CTA strategy ready to turn 180-degree to capture the ‘crisis alpha’, or a long vol fund expecting a major reset in the VIX, chances are you will not grab the brief moment, the diem. More generally, perverse incentives (no skin in the game) motivate the institutionalised asset management industry into crowding in at around the cliff edge, and then push forward off it.
Catching a major discontinuity in markets it’s lumpy business, no continuous game; this is what makes it tough for many to position for. Just as important, it’s comforting and safe to be in the crowd; extremely distressing to be out. It requires radical thinking and full independence. Again, you either in or out.
Blink and you’ll miss it. The scope for a flash crash. Our blueprint for the next daily liquidity crisis event is the Quant Quake of August 2007. [link]
Timing matters; but being right matters more. In the 1930s, Keynes said that markets can stay irrational longer than you can stay solvent. Yet, this is to put into context. When the cycle of the markets sits on a long wave - at the end of a prolonged journey which lasted probably 40 years now, ever since the end of Bretton Woods monetary system - usual metrics of investing success are an obstacle, not a comfort. They help casting the net underneath unaware or complicit, greedy or impatient investors.
You reap what you sow. [Galatians 6:7]
Not that there is a shortage of recent evidence of impending chaos.. hot stocks meltdown and US Repo mess in mid-September, interest rates cratering in mid-August, market precipitous dive in Q4 2018, the VIX complex quake in early February 2018, first mushrooms of fake liquidity popping up (GAM, Woodford, H2O). If we have to guess, the blueprint for the next real crisis, large-scale, is still the Quant Quake 2007, except 10X worse as this time it hits the core of the market instead of one small colony, followed by a prolonged bank holiday. A financial meltdown, with no strict necessity of consequential real economy shock. In this, dissimilar to the credit crunches of 2008 and 1929, and more similar to financial mayhem in 1987, 2000, and 6th August 2007 (although the latter was only visible to the quant community). But let’s not dive into anecdotal evidence and keep this piece high level – a Scenario.
Measuring It All
Using tools provided for by physics - and Complexity Science in particular, we attempted to substantiate the ‘Critical Transition Hypothesis’ with a family of quant indicators; for nothing is truly relevant and informative unless it’s measurable.
Without any assumption of its truth, we tried to prove - in not just qualitative arguments but also mathematical quantities - that markets propelled into over-extension (self-reinforcing positive feedback loops), are ready to snap (unstable equilibrium, lower basin of attraction, critical thresholds breached), in violent fashion (runaway effect and non-linear dynamics), heading towards a deep financial rupture in proximity (bifurcation & early warning signals).
Dies nigro signanda lapillo. [When Ancient Romans would signpost a bad day with a little black stone.]
In particular, we attempted at measuring the following quantities:
-
The expensiveness of the equity market, in relation to its growth potential. The ‘Peak PEG ratio’ is a price to peak-earnings multiple, adjusted for long-run trend growth. It is a simple measure of how expensive a stock market is relative to its ability to generate earnings. link
-
The expensiveness of the bond market, in relation to its scope for growth and inflation. The ‘Real Rates to Trend Growth ratio’. link
-
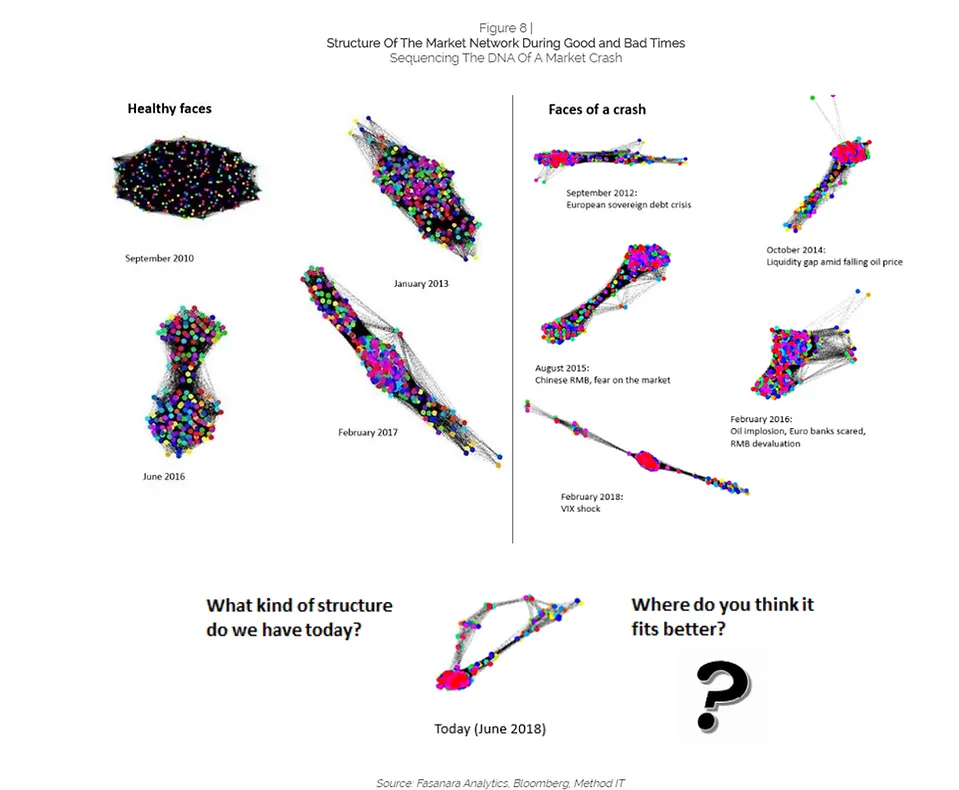
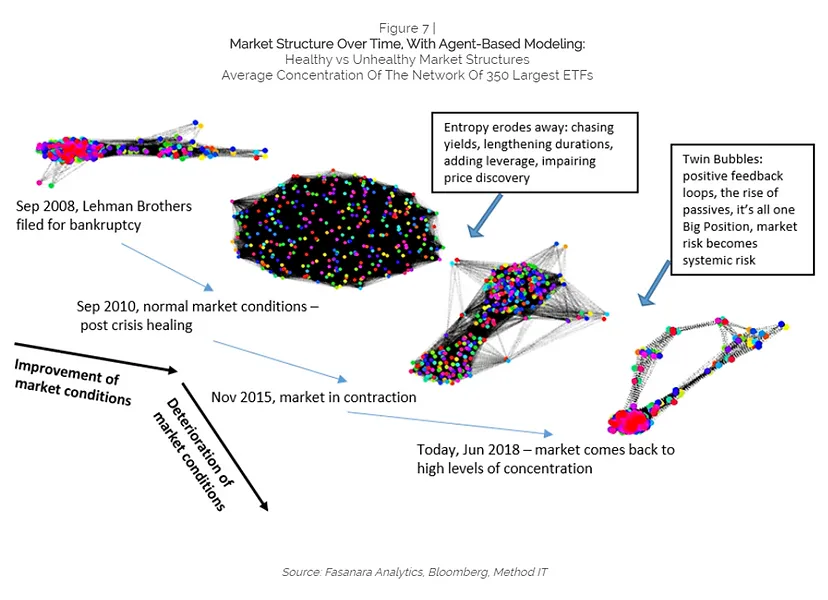
The visual analysis of the market structure during periods of stress. Alessandro Balata in the Fasanara Analytics team worked on visualizations tools of the structure of the market network during good and bad times, trying to isolate the DNA of a market crash. What resulted was a visual chronicle of how the market structure weakened relentlessly in the last ten years, to get more concentrated, entropic-fragile, and ready to snap. link
-
The minimum trigger to a market epidemic. The possibility for a flash daily liquidity crisis: a market-endogenous blink-and-you-miss type event. Yaniv Proselkov and Alessandro Balata analysed ‘Cascade Effects In Modern Undiversified Passive Markets’. They attempted a Liquidation Agent Based Model, offering a numerical simulation of a liquidity gap event using a network model of the market link
-
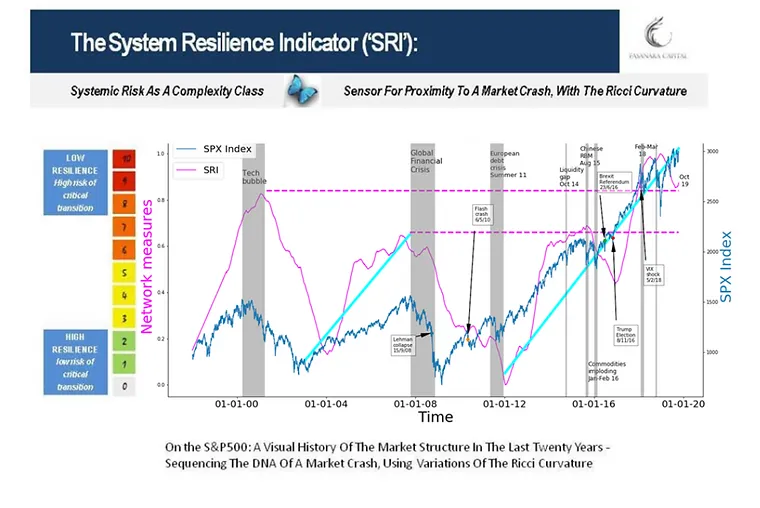
The long wave of Systemic Risk, the proximity to a market crash. Andrea Marcello Mambuca and Alessandro Balata worked on measuring system degradation over time, with indicators strictly not volatility-based, but rather based on agent-based modelling and the Ricci curvature. The result was the System Resilience Indicator (‘SRI’). link
Now we add a new screwdriver to the toolkit. Or perhaps better to say a pair of eye contact lenses. While the SRI looks at long waves of systemic risk (myopic lens), this one is used to try to detect shorter waves of market risk (presbyopic lens), thanks to the work of Mirco Lamperti from our Quant Team. It is yet another complexity-based indicator, defining the probability of a 10-15% decline in the next 15 days.
The idea being that while the long-wave SRI points to moments of maximum tension in the market (extreme leptokurtosis, entropic-fragility, Ricci curvature etc), the short-wave 15days indicator helps spot mini-crashes along the way. Inevitably, any big crash will begin as a mini-crash - a failed by-the-dip somewhere along the way, thus our interest in minor sell-offs. All around, agent-based-modelling market visualisation tools will help recognise how badly the market structure looks at the x-ray, at any point in time.
Cheerfully then, we can aim to help both myopic and presbyopic investors, to see the market structure for what it is. Astigmatic investors, with blurred visions from whatever distance, can instead refer to our work on real-time visualisations of the market structure. For dogmatic investors - that postulate that all is good, central banks can save the world and rates can dip to minus 5% if needed - we cannot do nothing unfortunately.
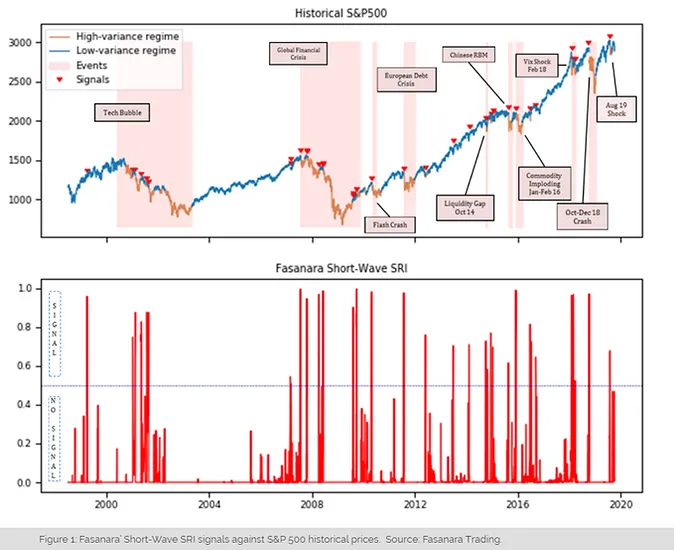
In a nutshell, Mirco built the Fasanara’ Short-Wave SRI, an Early Warning System (EWS) for short-term sell-offs in the U.S. equity market. Differently from classic systems, the EWS uses a set of complexity, economic and technical variables to assess the probability to enter a market turbulence period in the following 15 days. The model exploits both an Hidden Markov Model and an Artificial Neural Network to issue warning signals on a daily basis. In particular the construction of the EWS consists in two steps: (i) we estimate volatility regimes for the S&P500 using an Hidden Markov Model, and (ii) we establish a pattern classifier to predict a regime shift for the next period using an Artificial Neural Network.
With no further delays, let us update previous indicators below and introduce the Fasanara Short-Wave SRI: the 15-days EWS Indicator.
TOOL (1): Sequencing the Market DNA
The visual analysis of the market structure during periods of stress.
Alessandro Balata in the Fasanara Analytics team worked on visualizations tools of the structure of the market network during good and bad times, trying to isolate the DNA of a market crash. What resulted was a visual chronicle of how the market structure weakened relentlessly in the last ten years, to get more concentrated, entropic-fragile, and ready to snap. link
How does a crashing market look like in terms of topography/market structure? Here below we pit the healthy faces of the market, in peaceful blue-sky environments, against the ugly faces revealed when a stressor is imposed upon them. _ One big annotation: no truly meaningful crash occurred ever since the Lehman-moment. Here we only see timid, tepid, shallow, fleeting market sell-offs. None of them lasted, if anything they got more and more irrelevant over the years as the buy-the-dip mentality compounded. Critically, none of them look even remotely similar to the one we expect in the not-so-distant future for markets. Still, they can be analysed as ‘small-scale rehearsals’ for the Big One approaching, and certain general properties of their structure can be learned._
TOOL (2): Simulating & Monitoring Cascade Effects and Propagation Risk
The minimum trigger to a market epidemic. The possibility for a flash daily liquidity crisis: a market-endogenous blink-and-you-miss type event.
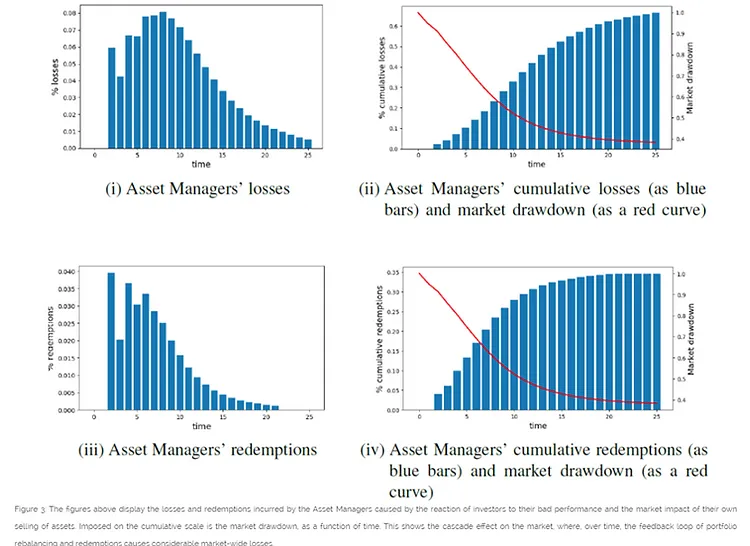
Yaniv Proselkov and Alessandro Balata analysed ‘Cascade Effects In Modern Undiversified Passive Markets’. They attempted a Liquidation Agent Based Model, offering a numerical simulation of a liquidity gap event using a network model of the market link
Here above we display the losses and redemptions incurred by the top Asset Managers due to investors’ reaction to their bad performance and the market impact of their own selling of assets. The cascade event is triggered by an abnormal large overnight redemption, and then we observe how the subsequent sell off of assets will trigger feedback of additional redemptions and sell-offs. It could mean that, following an idiosyncratic shock to a single stock and subsequent cumulative redemptions of approx. 15% on the 3 largest Asset Managers alone, the drawdown of the US equity market (as proxied by the Nasdaq) could reach 60% after 20 days.
TOOL (3): Fasanara Long-Wave System Resilience Indicator (‘SRI’)
Sequencing the Market DNA. The long wave of Systemic Risk, the proximity to a market crash.
Andrea Marcello Mambuca and Alessandro Balata worked on measuring system degradation over time, with indicators strictly not volatility-based, but rather based on agent-based modelling and the Ricci curvature. link
The Quest For A Quantitative Indicator Of System-level Market Fragility. How do you assess the vicinity of a major market crash? Do we have the right conceptual framework and tools to monitor the build-up of systemic risks and the approaching of a seismic shift? How can we go about quantifying market fragility and inherent vulnerability of the financial system? We are on the lookout for signals emerging from the structure of the market itself. The quantitative indicator that follows is then related to the structure of the market, its price dynamics and the behaviour of its economic agents. In the graph below, you see the results for our system-level resilience indicator for both the S&P500 and the Nasdaq, on a time series of the past 20 years.
The product consists of three main ingredients: (i) Accepted measures of system resilience / fragility in physics and energy systems: global network Entropy, the Ricci Curvature, graph diameter, shortest average path, maximal Lyapunov exponent; (ii) Early warning signals typical of complex systems in transition: things like critical slowing down, flickering/bi-modality, variance, autocorrelation/memory, skewness of swings, correlation/spatial patterns, pockets of stress (as discussed in earlier notes: pages 29-30 of this presentation). (iii) Select conventional market indicators, in detecting shifts in behaviour/sentiment for economic agents
TOOL (4): Fasanara Short-Wave SRI: The 15d EWS indicator
Capturing Small-Scale Market Dips. This is a complexity-based indicator, defining the probability of a 10-15% decline in the next 15 days.
The model exploits both an Hidden Markov Model and an Artificial Neural Network to issue warning signals on a daily basis. In particular the construction of the EWS consists in two steps: (i) we estimate volatility regimes for the S&P500 using an Hidden Markov Model, and (ii) we establish a pattern classifier to predict a regime shift for the next period using an Artificial Neural Network.
TOOLS (1) to (4): Systemic Risk Observatory
The Short-Wave indicator is not activated at present. Any one of the next signals is important as it has the potential to propagate across, given where Long-Wave SRI, market DNA visualisation, propagation sensitivity estimations are.
All in all:
Predicting Market Sell-Offs : An Early Warning System for the US Equity Market
Mirco Lamperti
October 21, 2019
Abstract
This study introduces Fasanara’ Short-Wave SRI, an Early Warning System (EWS) for short-term sell-offs in the U.S. equity market. Differently from classic systems, the EWS uses a set of economic and technical variables to assess the probability to enter a market turbulence period in the following 15 days. The model exploits both a Hidden Markov Model and an Artificial Neural Network to issue warning signals on a daily basis. In particular, the construction of the EWS consists in two steps: (i) we estimate volatility regimes for the S&P500 using an Hidden Markov Model, and (ii) we establish a pattern classifier to predict a regime shift for the next period using an Artificial Neural Network. Results show that an EWS of this kind successfully predicts the greatest part of remarkable market drops with good values of both precision and recall.
1. Introduction
Both practitioners and academics generally agree that financial crisis are an eventual outcome of continuous long-term deterioration of economic fundamentals (Krugman 1979; Obstfled 1986; Eichengreen et al., 1995). This has been particularly true for the greatest part of the modern financial history and, as an outcome, most early warning indicators have been developed and designed to monitor long-term macroeconomics trends. Hence, they usually predict a potential financial crisis on a long-term basis estimating the probability of a crisis within two-three years or so. In the recent decades, however, the market started evolving and becoming increasingly fragile on different time scales.
Both short-term sell-offs and major crisis may arise quickly from instabilities of financial markets without any significant deterioration of the macroeconomic fundamentals. Models based on long-term fundamental trends are hence poorly equipped to deal with such types of events, as macro variables usually react very slowly. Contrarily, these types of crisis tend to remain silent for a long time, but when they reach a tipping point the sell interest rapidly increases and the risk escalates.
The approach we embrace in this study is based on a shorter-term horizon, in a way to allow our Fasanara’ Short-Wave SRI (i.e., the Early Warning System) promptly react to any signal of change in financial conditions that emerge on the markets up to the daily frequency. To this end we employed data at daily frequency and we divided the analy-sis in two broad parts. As a first step an Hidden Markov Model (HMM) is developed to monitor daily movements of financial markets and detect any change in the underlying volatility. Secondly, we build an Artificial Neural Network (ANN) and employ a set of economic and technical variables to feed it. Once the ANN is trained, we employ it to predict the chances of entering a high-volatility regime in the n periods ahead.
2. EWS Construction Methodology
In literature there is much empirical evidence about the existence of a ’grey zone’ markets go through before a collapse (Oh, Kim, and Kim, 2006). Within a grey zone, the market can either return to its normal state or start to sell-off. Thus, it is crucial being able to recognize those grey zones to prepare for a turbulence period. The aim of the present analysis is to recognize these zones, especially for short-term drops.
A key step before we proceed with the actual prediction is to precisely identify the sell-offs periods we want to predict using our ML algorithm. For this reason, we chose to employ an Hidden Markov Model with two regimes to detect shifts between a low-volatility regime and a high-volatility regime (see Kim, Nelson, and Startz, 1998 and Hamilton 1989 for further reference). Generally speaking HMM is a generative probabilistic model, in which the system being modelled is assumed to be a Markov process with hidden states. The transitions between hidden states are assumed to have the form of a first-order Markov chain and can be specified by the initial probability vector and a transition probability matrix.
To estimate volatility regimes we use a model with no mean effect and switching between two regimes which can be described as:
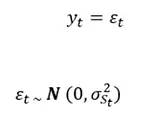

Given this model specification, we start by looking for good starting parameters using 5 steps of the expectation maximization (EM) algorithm and then we proceed to fit the model via maximum likelihood estimation. This way we derive model’s estimates for the high-volatility periods which will be used to feed our ANN. However, given the fact we want to learn our ML algorithm to recognize the grey period before a sell-off and not the high-volatility period itself, we need first to shift the first day of high-volatility and pad it for an arbitrary number of days; for the purposes of the present work we chose this period to be equal to 15 days. This last step returns us our proper objective variable.
Before we proceed with the construction of the ANN we need to define our training data set. First, we split the dataset in two parts, the training period (TP) and the testing period (OS). Then, we construct the training dataset for the state space {(X1t, ..., Xst, Yt) : t in TP} where (X1t, ..., Xst) and Yt denote respectively (i) our set of input variables and (ii) our objective variable. More precisely, we force Yt = 1 if t in (TPv-15, TPv) and Yt = 0 if t not in (TPv-15, TPv) where v is the sequence containing the first day of each high-volatility regime, and then we apply an oversampling technique to take care of the classes imbalance in the objective variable.
Regarding model’s inputs we chose a set of variables which well depict and summarize the market complexity behind the dynamics we aim to predict. Under the hypothesis that market drops, as well as crisis, may arise from quickly instability without the deterioration of any macroeconomic fundamentals, the structure of the market become the key driver of such market dynamics. Keeping that in mind we chose to employ variables which describe the behaviour of the system "market" (e.g. market recovery speed, market resilience, aggregation level, asset-class co-movements, etc.) and whose alteration may help us to spot short-term tipping points.
At last, to develop our classifier, we design and train the ANN with the above training dataset, we apply the classifier to the test period OS, and check the performance of our algorithm.
3. Results
The behaviour of the Fasanara’ Short-Wave SRI is given in Figure 1. The chart can be read as a sort of seismograph that records any "pre-activity turbulence" in the market and raises a signal if it reads the market to be likely to erupt. More specifically, the index ranges from 0 to 1 and reports model’s level of confidence that the market will enter a turbulence period in the two weeks ahead, i.e. the probability of switching from a HMM low-volatility regime to a high-volatility regime in the subsequent 15 days. It is relevant remarking that one should read the output as a signal only if the line exceeds 0.5 threshold and should consider any other movement in the chart as normal market activity.
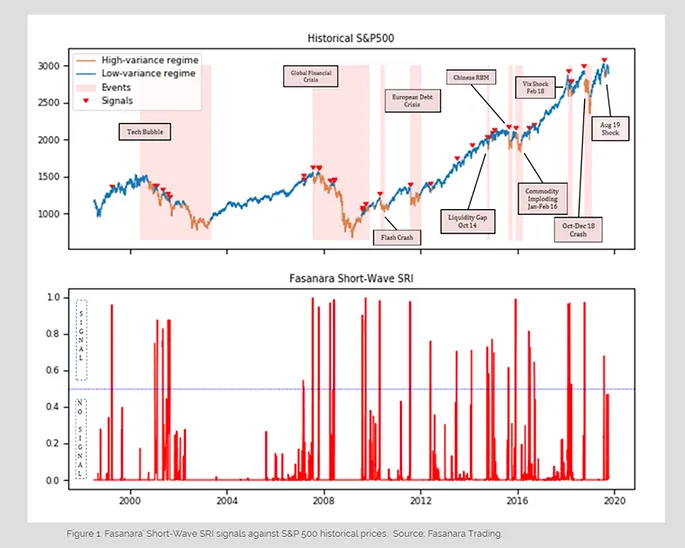
As one can see from the chart the signals distribute quite uniformly along all the 20 years we consider in the analysis (with the only exception of the 2003-2007 bullish market), meaning that the model is prone to detect not just crises and extended bearish periods, but also (and more specifically) short term drops in bullish markets, which was indeed one of the main aims of this work.
In Figure 1 we also compare the output line with the S&P 500 historical prices from 1998 to 2019 along with the narrative for every major market crash reported in the chart. When we examine the behaviour of the EWS with respect to these events, we note that our model successfully predicts every major market crash occurred in recent history. Furthermore, it offers - on average - an edge in terms of time to respond to the signal, granting the investor the possibility to hedge his positions before the market sell-off starts.
Model Accuracy
One of the most common model evaluation metrics used for classification problems is the accuracy score, defined as the number of correct predictions over the total number of predictions. Our model reports a 0.9964 accuracy score. However, since a market crash is a considerably rare event, the "sell-off days" are heavily under-represented in our sample with respect to the "normal days", the accuracy by its own is not a good measure for model quality. For this reason we report below the whole confusion matrix.
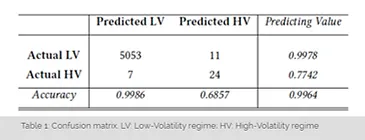
The above confusion matrix shows, along with the overall accuracy, all the information we need to properly evaluate the model quality. In the core part of the table we report the number of predictions divided in four different buckets (clockwise, True Negatives, False Positives (Type I error), True Positives, and False Negatives (Type II error)). As our aim is to predict an incoming sell-off in the market, it is clear that we are not interested in how good our model is at predicting a "normal day". Thus we want to focus just on two out of the five metrics reported along the table: the rate of correct positive predictions out of the total number of positive predictions (i.e. model precision score: 0.6857); the rate of correct positive prediction out of the total positive observations (i.e. model recall score: 0.7742). It is also common practice to combine those two scores in a unique synthetic indicator (F1) for the model:

which leads to a F1 score of 0.7273, revealing that our model is a quite good predictor of incoming market turbulences. However, even if it is good to have a unique quality indicator, it is worth notice that precision and recall are better indicators in specific situations. Indeed, for one investor who is betting on a market crash the Type I error represents an actual loss, meanwhile a Type II error represents only a missed gain. Hence, she will probably be more likely to use the precision to evaluate the model quality (an opposite argument holds for the investor who is seeking for convexity hedge).
Impulse Response Analysis
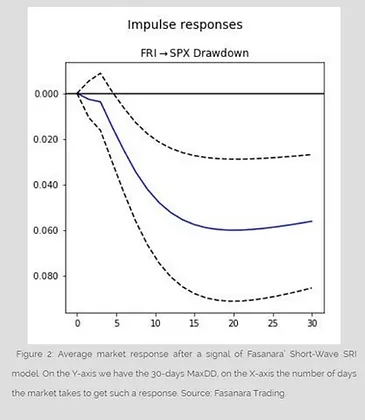
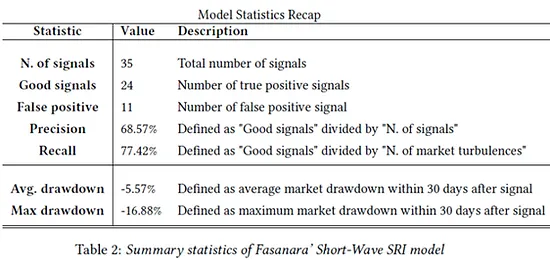
Finally, it is worth investigating the effective market response after our EWS model raises a flag. To this end, we need to answer two questions: (ii) does it really anticipate the market drop and by how much time; and (i) what is the average deepness of the predicted market drop. Keeping those questions in the back of our mind we chose to clean the output from everything which is not a signal and run an impulse response analysis against the 30 days market maximum drawdown. Our impulse response analysis allows tracing the transmission of a single shock to a variable, yielding a quantification of its response. After creating multiple lags of our explanatory variable, we regress our 30-days MaxDD against them in order to measure its response to each lag. The results of such analysis are reported in Figure 2, where the blue line represents the average response of the market to a signal, while the dot-ted lines represent the 95% confidence interval for each point in the blue line. As one can notice both the dotted lines go below zero after the 5th lag, meaning that we are confident to see an effect on the market already after 5 days from the signal. Further, it reaches its minimum at the 18th lag, meaning that we need to wait at least 18 days to see the greatest market drop (-5.57% on average, see Table 2 reporting all relevant statistic for the model).
4. Concluding Remarks
Recent market crashes and sell-offs (e.g. the "Quant Quake" in August 2007, also referred to as "August factor") have given credit to a new type of hypothesis: financial crisis may abruptly arise from market instability, without the need of tightening economic conditions or banking system degradation. To handle and quickly react to such kind of events, the market, and its structure in particular, have to be monitored on a daily basis. In this analysis, we propose an Early Warning System based on an Hidden Markov Model and an Artificial Neural Network whose aim is to detect characteristic patterns in the periods preceding a sell-off. We find that our Early Warning System successfully predicts the greatest part of remarkable market drops without give up good values of precision and thus limiting the number of false positive signals. We remark the importance of a proper selection of the input variables, since the efficacy of the EWS relies on an appropriate training and the set of input variables are used to identify similar patterns. Finally, we test the model accuracy and we demonstrate in our empirical study that an approach like the one we adopt is a valid methodology for day to day market monitoring.
References
-
Barry Eichengreen, Andrew Kenan Rose, C. W. (1996). Contagious currency crises. NBER Working Paper.
-
Chang-Jin Kim, Charles R. Nelson, R. S. (1998). Testing for mean reversion in heteroskedastic data based on gibbs-sampling-augmented randomization. Journal of Empirical Finance, 5:131–154.
-
H. Adeli, S. H. (1995). Machine learning: Neural networks, genetic algoritms, and fuzzy systems. New York: Wiley.
-
Hamilton, J. D. (1989). A new approach to the economic analysis of nonstationary time series and the business cycle. Econometrica, 57(2):357–384.
-
Japkowicz, N. (2000a). The class imbalance problem: Significance and strategies. ICAI’2000.
-
Japkowicz, N. (2000b). Learning from imbalanced data sets: A comparison of various strategies. AAAI Technical Report.
-
Krugman, P. (1979). A model of balance-of-payments crises. Journal of Money, Credit and Banking, 11(3):311–325
-
Kyong Joo Oh, Tae Yoon Kim, C. K. (2006). An early warning system for detection of financial crisis using financial market volatility. Expert Systems, 23(2).
-
Obstfeld, M. (1986). Rational and self-fulfilling balance-of-payments crises. American Economic Review, 76(1):72–81.
-
Ramaprasad Bhar, S. H. (2004). Empirical characteristics of the permanent and transitory components of stock return: analysis in a markov switching heteroscedasticity framework. Eco-nomics Letters, 82(2):157–165.
-
Tae Yoon Kim, Kyong Joo Oh, C. K. (2004). Artificial neural network for non-stationary time series. Neurocomputing, 61:439–447.
