scenarios
Cascade Effects In Modern Undiversified Passive Markets
Research Team
29 April 2019

The US equity market is back to all-time highs. Or, has it really gone nowhere for 15 months now? Is it time to send the all-clear signal, or have we got reasons to be more worried than before? How to assess how bad a damage can emanate from daily liquidity gap risk hitting abruptly on over-concentrated un-diversified over-expensive over-passive markets, in twin bubbles formation (US for equities, European/Japanese for bonds), all the while as exhibiting the ephemeral liquidity misstated by the phoney statistics of decade-long public-assisted markets.
The real danger in the markets today is not trade wars, a recession, the FED, China or European Banks, but the structure of the market itself. The risk of a 2trn daily margin call / redemption event in markets is not a theoretical exercise, it is indeed a workable assumption. Against that, there is no FED, ECB nor BoJ put together. A massive move overnight is then made entirely possible, by undiversified retail passive daily money. We attempt a Liquidation Agent Based Model, offering a numerical simulation of a liquidity gap event using a network model of the market, and show how select indexes could fall up to 60% for rather limited shocks to some of its constituents.
Wheels Started To Come Off
To us, the wheels started to come off in Q4 2018, with a fast melting S&P/Nasdaq, nosediving economic indicators and suddenly freezing credit markets. A bad month was all it took for Central Bankers to have second thoughts, for the supposedly-strong real economy to grind to a sudden stop, for markets to enter histerical convulsions.
Confirmation Of Phase Transition Zone
A fragile financial system, that needs little much to kick off chaotic season, precipitously. The violent recovery experienced subsequently is also itself explained by the descriptive metrics for complex systems in phase transition zone: it has the name of ‘bimodality / flickering’ (refer to slide 30 here). Strong but slower than in recent years, proving true another key characterisation of critical transition for a system, called ‘critical slowing down’. Slow but steady and progressive, in low volumes at first, indicating passive vehicles drove the market rebound all along. Back to value-insensitive auto-pilot. And back to the happy days of bad news / good news.
A Single Bad Quarter Had Active Managers Burn Years Of Gains
The behaviour of many strategies over the last quarter of last year has information value. The magnitude of losses, together with the speed at which they accumulated, is indicative of the dramatic level of crowding, low diversity and widespread fragility the market has engulfed into. As of the third week of December, during market mayhem, how many managers had burned years of slowly accumulated gains in low volatility, and were plummeting at an alarming pace, in suddenly uncharacteristic volatility? Our thesis of low-diversity market structure met the first real empirical evidence.
The gap between active and passive narrowed more and more, low diversity disseminated, irrespective of the name tag for the strategy at hand. Forget passive vs active, risk premia vs risk parity, CTA vs quant, value investors vs momentum: if one was to do a factor investing analysis of the market as a one big whole, few factors only would explain it all: long Beta, Long Carry, Short Vol, Long Illiquidity. The single mantra of markets has become ‘be long, sell vol’: and you’ll do fine most of the time. And be wiped out in the other few. Remember the perils of crossing a 3 metres wide river, on average, with a 5 metres long bridge. Remember the best performer XIV ETP (up to the very day of r.i.p.). Remember Bertrand Russell’s cheerful chickens, always happy except one single day in their life.
FED Panic Reaction Speaks A Thousand Words
Has the dramatic U-turn by the FED upon a single bad month of market performance been a tangible proof of how fragile the whole market construct has indeed become, or was it just folding to political pressures? How frail has investor and policymakers mentality become, how millennial-type has is morphed into, if a surgeon is used to treat a cold. Or, conversely, was it not just a cold but admission to a deeper malaise? Was a month of market woes enough to justify moving from Quantitative Tightening to Quantitative Easing? Because not hiking rates is not QE, but reinvesting maturing Treasuries is indeed QE. Not enough: active talks of MMT at the end of a 10-year bull run were then also deemed appropriate. Such an epic U-turn has the looks of a smoking gun. Excusatio non petita, accusatio manifesta.
QE-7: Jumping The Shark
The latest attempt at spurring economic growth through yet another round of QE and talks of MMT have the FED enter ‘jumping the shark’ modality! The expression ‘jumping the shark’ is less known to Europeans than it is to Americans, familiar with the TV series Happy Days. It originates from the episode of Happy Days broadcast in Sept 1977 in which Fonzie, dressed in his trademark leather jacket, literally jumps over a shark on water skis (if you don’t believe it.. see it here). The episode, which came at a time when the long-running series was already considered past its best, was seen as the a virtual admission by the programme's makers that the series had run its course, and that they were deficient of ideas.
Past its peak of marginal effectiveness, beginning a downhill slide to mediocrity or oblivion. The beginning of the end, for the tool.
What Cost Is Too Great To Spur Economic Growth
Artificially boosting the economy and the financial markets with QE and tax cuts simultaneously, in the multi-trillions and for a prolonged period of time, swaps today’s semblance of stability and growth with tomorrow certainty of un-proportional risks to financial stability. Trading short-term solutions for long-term problems. When is it then that too much good money is thrown after bad, and accounts for therapeutic obstinacy? When is it that risks are too great to continue perpetuating the same policy over and over again, while even the slightest retrenchment shows the achievement for what it is: illusory, fragile, un-durable.
Meanwhile, financial systemic risk is only an afterthought.
Asking The Right Questions
In the political arena, the biggest elephant in the room nowadays is unequivocally Income Inequality, progressively leading to political unrest, populism, identity politics and regime changes, in so many countries now around the globe, in a trend that seems well entrenched and set to power ahead. Critically, Income Inequality is intertwined with QE and ZIRP, unmistakably. As we argued in a recent podcast with MarcoVoices (available here), it is then both surprising and unsettling to see that ‘policy makers never ask themselves, at this very stage, if a certain measure like QE4 or QE-forever out of the Federal Reserve, for example, would increase or decrease income inequality. And we think it’s about time that it does.’ Until it does, the risk of political discontinuity is high, and with it political retaliation against the haves vs the have-nots, against rich corporates vs households, against asset-owners vs asset-free, back feeding into price action at some point down the road.
The Ideal Environment For Gap Risk And Chaotic Market Behaviour
Daily liquidity vehicles, be it ETFs or several other formats in major economies, have never been as large as they are today. Passive auto-pilot vehicles, either in the form of fully-quant funds, systematic, quantamental, CTA or supposedly-active-but-turned have never been as large a share of the total as they are today. Fickle retail investors never had as easy a direct access to markets as they have today through ETFs of the most disparate natures, often overselling liquidity (way above that of their underlyings) and diversification (often a fraction of what is portrayed).
Unlocked hot money, retail driven, passively managed: the daily liquidity risk is highly underestimated today. With it, the so-called ‘gap risk’, especially overnight gap risk. Which bring us to the real danger in markets these days being the market itself.
The risk of a $2trn daily margin call or redemption event in markets is not a theoretical exercise, it is indeed now a workable assumption. How would a market showcasing ‘phantom liquidity’ take it? What would trigger it? When the top three asset managers alone command a staggering $14trn of AuM, for the most part retail/daily/passive, the issue should be on every market regulator/participant table, and is not. Against that, there is no FED, ECB nor BoJ put together. A massive move overnight is then made entirely possible, by undiversified retail passive daily money.
The Real Danger Is The Undiversified Passive Market Itself
With a market as full of potential energy and ready for transition as the one we live within, a catalyst is not needed. Or at least not a major catalyst. A small perturbation can be all it takes, at some unidentified point in proximity. The real danger is not trade wars, nor US recession, nor the FED, nor China, nor European Banks, but rather the structure itself of the market, which can implode under its own weight at a moment’s notice.
Our blueprint for the next crisis is not 1987, 2000 nor 2008. But rather the ‘Quant Quake’ of August 2007. Also referred to as the ‘August factor’. At that time, renowned quant funds, including the famed Goldman Sachs QIS fund, lost 30% in short order: without any apparent reason - which itself tells a lot about market brittleness. Except this time around it may be 10-fold worse, insofar as it would not be isolated to quant funds but rather sprawling across fast through the undiversified passive expensive financial network. We discussed it recently in this outlook: A Glimse at 2019.
Markets In Free Solo Climbing
In free solo climbing, that is rock climbing without a rope, the slightest mistake means certain death. Markets too are progressively pushing to the edge. The risk is that they will eventually find it.
US Equities – the largest globally - climbed to peak valuations, in more and more passive and undiversified ways across its participants, growingly doing so in daily liquidity formats, higher leverage and weaker collateral than before (as tax cuts and fiscal injections make profits shine). European bonds themselves – the largest globally, in similar and simultaneous fashion, climbed to peak valuations, in defiance of inflation or any other usable metric. Loans in the US, and more surprisingly in Europe too, trade at historically low potential recovery rates, lite as ever covenants (if any), and minimal yields to (not) compensate for. No safety nets / buffers anywhere in sight, and it has been a while now. Clock is ticking.
Modelling Shock Waves Cascade Effects
In the quantitative analysis that follows, Fasanara Capital’s quants Alessandro and Yaniv created a network model simulation and presented a possible outcome of an idiosyncratic market correction, and subsequent fund redemptions in chain-effect. The results suggest that, in an healthy system, these kind of events should not trigger market-wide distress. However, the loss cascades observed in the market model suggest unhealthy conditions of market fragility. These loss cascades suggest that the structure of the market, as well as unsustainable behaviour by its biggest players, is jeopardising the stability and resilience of the system.
That is, the research suggests that there is a systemic fragility in the market, and this may put it at risk of collapse.
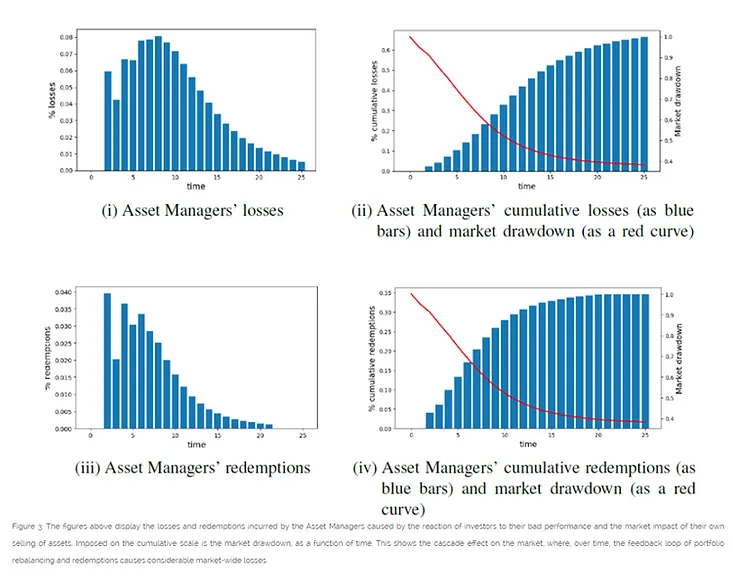
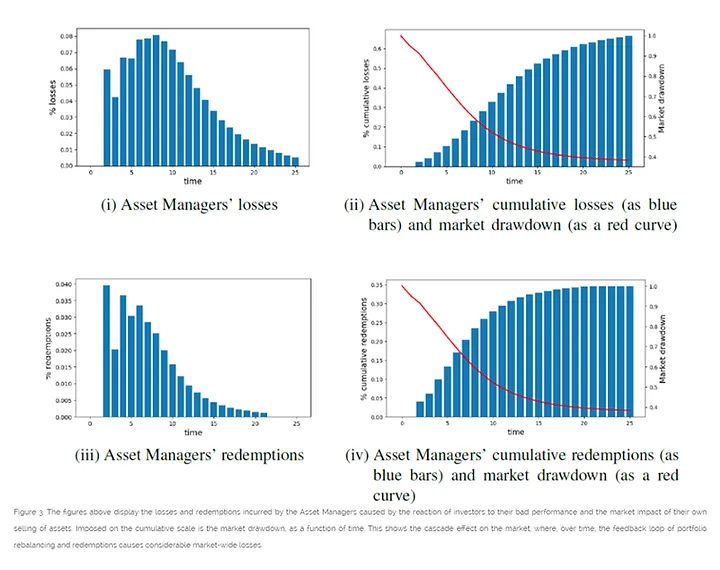
The note attached shows the impact on the NASDAQ of a cascade event triggered by an idiosyncratic shock to a single stock, under the current levels of fear and liquidity. It can be noticed that such an event could result in a market-wide drawdown of up to 60%, primarily caused by repeated withdrawal of capital. This is in response to bad performance that, in turn, forces an asset manager to liquidate additional assets and put increasing pressure on prices, eventually causing a market meltdown.
Cascade effects in modern concentrated financial markets
Analysing the network effects of sudden shocks in undiversified passive markets
Alessandro Balata and Yaniv Proselkov Fasanara Capital April 29, 2019
In these notes we present a network simulation model of the market where we stress test the impact of an idiosyncratic shock to a set of specific companies on the market as a whole. This is done by examining the cascade effect triggered by the redemption of large portions of assets from similar, mostly passive asset managers.
1. Introduction
Most asset managers have similarly distributed portfolios. This is largely due to the overwhelming prevalence of passive ETFs, and how a large proportion of the financial market’s money is locked up in such funds. This is especially true in US markets, and since they matter the most, given their sheer magnitude as a percentage of broader global financial market, this matters the most for systemic risk. How dangerous to markets this is has been discussed by Fasanara at length in Fasanara Capital [2018a], and since early 2017 in Fasanara Capital [2017a] and Fasanara Capital [2017b]. In Fasanara Capital, this was further shown as an analytically defined network measure of fragility, known as the “System Resilience Indicator” (SRI), which used a purely structural measure of network fragility, the Ricci Curvature, to develop a further measure of market fragility. It shows that markets are even more fragile than they were during the dot-com bubble, although there has been no collapse yet.
In these papers, through the lens of nonlinear dynamics, the Fasanara team shed light on how such homogeneity is indicative of the markets approaching a "critical threshold" on account of the observable "critical slowing down" of market movement, as described in Fasanara Capital [2018b]. This is due to the lack of change over time in portfolios, and lack of capacity for market origination. Each is a consequence of living in the wake of market manipulation and suppression of volatility, driven by the policies of QE and Zero Interest Rates the world over.
This fact was explained in Fasanara Capital [2017c] over a year before developing the SRI. The delay in a deep adjustment in markets is a consequence of large fiscal injections in the US in 2018 and the reinstatement of QE in 2019. This is through the interruption of rate hikes and reinvestments of maturing treasuries, which is itself a form of QE. Artificial buffers to total collapse were reintroduced, to buy more time at the risk of deeper adjustments to come, as systemic risks further compound on the same root causes. After a prolonged period of narcosis, provoked by QE and extreme policy interventionism, the market has lost its immune response to crisis. The buffers of resilience are no longer present, and the risk of instant liquidation has become like the sword of Damocles, dangling over the neck of an inherently fragile and illiquid market.
The highly liquid nature of ETFs and their relentless, yet relatively sudden rise highlights them as one of the weakest links in a growingly un-diversified asset management industry, together with other funds that offer daily liquidity to investors. If ETFs and other daily liquidity vehicles experience a significant amount of sudden redemptions, due to a mild market correction or other minor catalyst, the structure of the market would be unable to absorb the consequent sell off of assets without a severe adjustment to asset prices, making a market crash a probable outcome.
At present the market recognises the potential liquidity issues but appears satisfied with the risk, however if ETF volume continues growing at this pace, then this thinking may revise. The ratio of ETFs to managed funds is growing. In 2019, at the time of writing, ETF volume is at around $5 trillion, up from less than $700 billion before the 2008 financial crisis, and if expectations are correct, potentially reaching $10 trillion by 2022.
As capital is redeemed, passive ETFs will automatically sell off ownerships of the assets they are invested in, in an attempt to preserve target portfolio weighting. This generates a cascade that propagates through the network of managers and assets, which if subject to a large enough shock, devalues companies market capitalisation to the point of a critical threshold.
Redemption risk is a major concern for investors, and has been analysed in Morris et al. [2017] and Grill et al. [2018]. Other papers have used agent-based models addressing inter-bank debt, as in Birch Annika and Aste [2014] and then Birch et al. [2015], or in Levy-Carciente et al. [2015]. However, less has been written on simulating redemption actions. In this paper, we describe a general model for the reaction to sudden devaluation of companies in the form of instant redemptions of shares in ETFs. Using this, we investigate how large changes in asset value can propagate through a system, causing system wide collapse. We provide a numerical simulation of such an event using a network model of the market, represented by a set of asset managers and their investments, and the associated parameters that define their relationship.
The tech sector is subject to regular, cyclical revolutions, with periods of stability and growth, volatility, and then sudden crashes, in a process defined by disruptive innovations Yu and Hang [2010]. This stable period is overrun with speculative investment in both “unicorn” companies, valued at over $1 billion based on based on potential growth, given extremely rosy assumptions rather than hard data or past performance, and huge growth centric companies, such as Amazon. The PE Ratio of Amazon is just under 90 as of the time of writing, and its size is already greater than the total equity market cap of several of the G20 countries it is supposed to further penetrate into to support its current valuation. On account of their size and great potential for instability, we focus our analysis on these tech giants, and use NASDAQ listed stocks.
In the Section 2 we will introduce the model and the mathematics behind the update procedure. In the Section 3 we describe the results of the numerical simulation, wherein Subsection 3.1 we perform a sensitivity analysis, followed by Subsection 3.2 which gives an analysis of a shock even on current market conditions. Finally, this paper concludes with suggestions on further ways to extend the model, both theoretically and method-ologically.
2. A network model of the market
Consider a model of the market described on a two-mode network whose nodes are represented by N + 1 companies and M asset managers. We characterise the companies by their market capitalisation, Cn, the asset managers by their assets under management, Ai, and the asset managers’ level of leverage by Ai. We further denote the M (N + 1) target weights for the asset managers in the network by wi,n. The dollar amount invested by the ith asset manager in the nth company is represented by Qi,n.
These represent the initial state of a dynamic network model. To introduce dynamic behaviour, we induce a shock δ = (δ1, . . . , δN ) that hits the value of the companies, C0, . . . , CN . To indicate that this is a change in time, we add a superscript t to all variables. We model time with discrete increments, where each increment corresponds to an indeterminate amount of clock time before which all asset managers can react to new incoming information and consequently affect the market. Using cn to denote the initial market capitalisation of company n, we trigger a cascade reaction by inducing a shock on the value of the companies, which, for all n, is described by

The cumulative effect of a change in the companies’ market capitalisation on the assets under management of an asset manager is

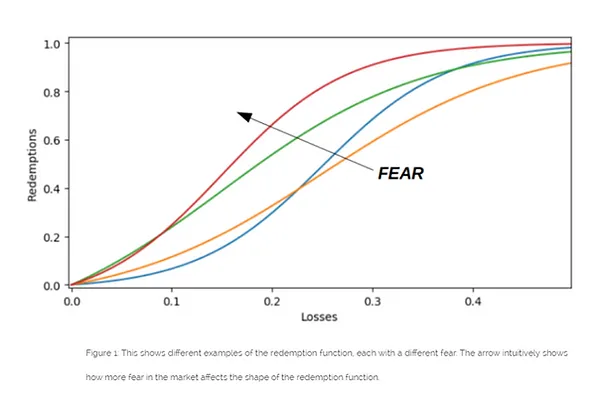
In the case of negative shocks, Ct+1 i< Cti , and so At+1i < Ati. That is, losses in market capital correspond to losses in assets under management. As an asset manager accumulates losses, their clients are incentivised to redeem their capital and move it to some other, better performing, manager. We denote the percentages of AUM that get redeemed as Ri and model this quantity with the function f , parametrised by the fear coefficient ρ, such that

where a and b are defined as normalising constants such that f (x) ∈ [0, 1], ∀ x ∈ [0, 1]. To compute the redemptions we plug in the change in assets under management, such that

The interpretation of the fear coefficient, ρ, is that as fear of losses increases, investors will redeem a greater percentage of their investment in response to worsening asset manager performance. We display in Figure 1 some examples of the redemption function for different values of the fear parameter.
The change in AUM over time for each asset manager is finally computed as follows:

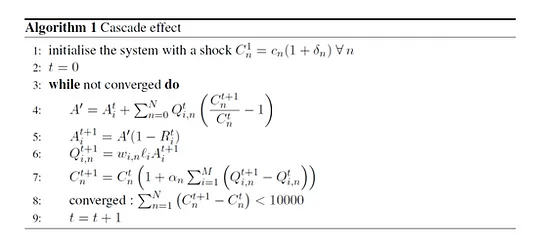
where we denote the positive part of c with c+ = max(c, 0). This reduction in capital further reduces the amount of cash available for holding a position in a portfolio, triggering a re-balancing, which is calculated as
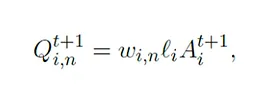
where wi,n represents the optimal allocation for the asset manager i, assuming this is kept fixed throughout a simulation. The liquidation of assets required to re-balance a portfolio has an impact on the valuation of the companies. We assume the latter to be proportional to the amount of shares liquidated and a specific price impact coefficient, αn > 0, such that
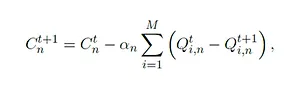
which is the final step of the model before restarting the procedure at the assets under management update step. This loops until convergence or market collapse. In this initial analysis, αn is defined in terms of λ, such that liquidity has a negative relationship with market impact. That is, αn = 1 λn, which is time invariant. Market impact, however, could also be made time dependant to model the drying up of liquidity during prolonged sell offs. To capture the decay behaviour, a simple definition would be αn,t = log (tαn). This was not used at present, because this would make the model even more prone to cascades, starting even from very conservation market impact coefficients.
This section has described each step involved in the core update procedure. In an intuitive sense, this model tries to capture the dynamics following a considerable market correction that triggers a cascade of combined fire sell offs, redemptions in day liquidity instruments, and portfolio re-balancing.
To conclude this section, we present in Panel 1 the algorithm used to compute the update steps of the market simulation. The following section will look at applying a numerical simulation, testing our model, and providing results on liquidity risk in the market as of April 2019.
3. Numerical Simulation
3.1 Sensitivity Analysis
In this section we calibrate and analyse the model introduced in Section 2 to identify possible catalysts of a cascade event which would lead to market collapse. Our aim is to show that the current market conditions, and the high portfolio concentration and homogeneity of the biggest asset managers, represent a source of risk that is often overlooked.
We trigger the market dynamics by probing the system with an idiosyncratic shock to few companies, and observe how the consequent sell-off can turn into a cascade/feedback loop of redemptions, portfolio rebalancing and companies devaluation. For the sake of these analysis we decided to test a shock to Facebook stock price of about 30%, along with a market (NASDAQ) correction of 5% and some other random market movement for the other stocks comprised in the model. Recall that the time steps used in the model do not represent uniform "clock time-steps", but rather they stagger time in equally significant, buckets of market activity.
We exploit the flexibility of the model to study how the market reaction to the aforementioned shock changes based on the market conditions and the psychology of the investors. This is done by selecting the price impact coefficient, reparametrised in terms of market liquidity coefficient as a proxy for the market liquidity, and the fear coefficient as a proxy of the general sentiment of the investment community. In Figure 2, we display a 3D representation of the market-wide correction triggered by the initial shock experienced by Facebook and the market as a whole. It can be observed that, for increasing fear and decreasing liquidity, the correction becomes increasingly severe.
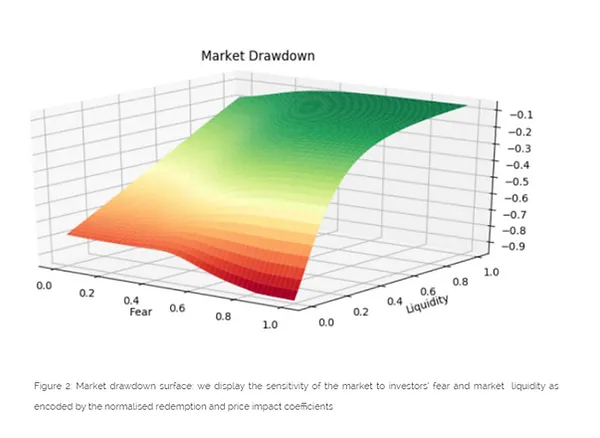
Figure 2 also allows us to assess the relative importance of both measures as triggers of a cascade event, and it can be concluded that, provided the market remains liquid, increasing fear in the investment community is not sufficient to trigger a market sell-off of noticeable magnitude. On the other hand, when liquidity dries up, even relatively low levels of fear can be sufficient to amplify the initial shock on the market ten-fold or more.
3.2 Current Market Conditions
Having established the overall behaviour of the model, we aim to identify the current market conditions through the value of the two coefficients representing fear and liquidity. Through multiple simulations and cross validations against real market data, we estimate the fear coefficient to be about 60%, while the liquidity coefficient about 30%, relative to the normalised values tested in the sensitivity analysis Subsection 3.1.
Using these parameters, we compute the simple and cumulative average losses and redemptions experienced by the asset managers in the market system over time. We display these measures in Figure 3, it can be observed how a crisis spreads over time through the market, and the redemption/loss profile that an asset manager can expect in the case of such an event.
The most informative result of this experiment, however, is shown by the red curve as in Subfigures 3ii and 3iv, which shows the impact on the NASDAQ of a cascade event triggered by an idiosyncratic shock to a single stock, under the current levels of fear and liquidity. It can be noticed that such an event could result in a market-wide drawdown of up to 60%, primarily caused by repeated withdrawal of capital. This is in response to bad performance that, in turn, forces an asset manager to liquidate additional assets and put increasing pressure on prices, finally causing a market meltdown.
4. Conclusion
In this research note we presented a network model of the market comprised by two different types of node - Asset Managers and Companies. After establishing the physics of the interactions among different market actors, we studied the sensitivity of the system to fear and liquidity conditions, as well as evaluated the current market conditions and presented a possible outcome of an idiosyncratic market correction. Our results suggest that, in an healthy system, these kind of events should not trigger market-wide distress. This is arrived at by observing that cascades of losses in our framework indicates that the way the market is structured, and the behaviour of its biggest players is jeopardising the stability and resilience of the system. That is, our research suggests that there is a systemic fragility in the market, and this may put it at risk of collapse.
We release these notes in their present form, intending to update this work with additional details on the calibration procedure, complement it with increasingly realistic assumptions and modelling choices, and deeper analysis into its internal structure.
References
Analysis of Market Structure: Towards A Low-Diversity Trap (2018) Fanara Capital Link
Positive Feedback Loops and Financial Instability: The Blind Spot of Policymakers (2017) Fasanara Capital Link
Twin Bubbles Meet Quantitative Tightening (2017) Fasanara Capital Link
How To Measure The Proximity To A Market Crash: Introducing System Resilience Indicators (SRI). (2018) Fasanara Capital Link
Fragile Markets: On The Edge Of Chaos (2017) Fasanara Capital Link
Fake Markets: How Artificial Money Flows Kill Data Dependency, Affect Market Functioning and Change the Structure of the Market (2017) Fasanara Capital Link
Redemption risk and cash hoarding by asset managers (2017) Stephen Morris, Ilhyock Shim, and Hyun Song Shin Link
Counterparty and liquidity risks in exchange-traded funds (2018) Michael Grill, Claudia Lambert, Philipp Marquardt, Gibran Watfe, and Christian Weistroffer Journal of Statistical Physics Link
Systemic Losses Due to Counterparty Risk in a Stylized Banking System (2014) Birch Annika and Tomaso Aste Financial Stability Review Link
Dynamical macroprudential stress testing using network theory (2015) Sary Levy-Carciente, Dror Y. Kenett, Adam Avakian, H. Eugene Stanley, and Shlomo Havlin Journal of Banking & Finance Link
A Reflective Review of Disruptive Innovation Theory (2010) Dan Yu and Chang Chieh Hang International Journal of Management Reviews